Summary: In this post I will explore and share my learning journey using BigQuery for doing Spatial Analysis. We can even visualize the queries in Unfolded Studio.
Keywords: BigQuery, Geospatial, SQL, unfolded.ai, Data, Census
Background
Recently, I’ve been learning SQL for an internship. To experiment with my new knowledge, I was tasked to pull data for San Francisco and Chicago from a SafeGraph Census dataset. Since this dataset is organized by block groups, I used the polygons in the US Census Block Group dataset to narrow the data down to San Francisco and Chicago using a spatial join.
First, I had to find polygons for the city borders of San Francisco and Chicago. There are probably multiple ways to do this, but I referenced this article on using Admin Boundaries with the OpenStreetMap dataset in BigQuery. Admin Boundaries include boundaries at different administrative levels in the government hierarchy, such as city boundaries, which is what I was looking for. Each level of the government hierarchy is assigned an admin_level, which you can filter for in your query. Both Chicago and San Francisco are at admin_level = 8. You can check the admin_level of different countries here.
Here is an example of what I did to get the boundary for San Francisco:
SELECT
(
  SELECT value
  FROM UNNEST(all_tags)
  WHERE key = 'name'
) AS name,
geometry
FROM
`bigquery-public-data.geo_openstreetmap.planet_features_multipolygons`
WHERE
('boundary', 'administrative') IN (
  SELECT (key, value)
  FROM UNNEST(all_tags)
)
AND ('admin_level', '8') IN (
  SELECT (key, value)
  FROM UNNEST(all_tags)
)
AND (('name', 'San Francisco') IN (
  SELECT (key, value)
  FROM UNNEST(all_tags))
  AND
('is_in:country', 'USA') IN (
  SELECT (key, value)
  FROM UNNEST (all_tags)
))
Details
It turns out there are multiple San Franciscos at admin_level = 8 across the world, so I also had to filter for the country using is_in:country. Be careful with the tags you filter for though, since not all places have the same tags.
Now I just need to perform the spatial join. This was my first time using a spatial function, and I used this article as a reference.
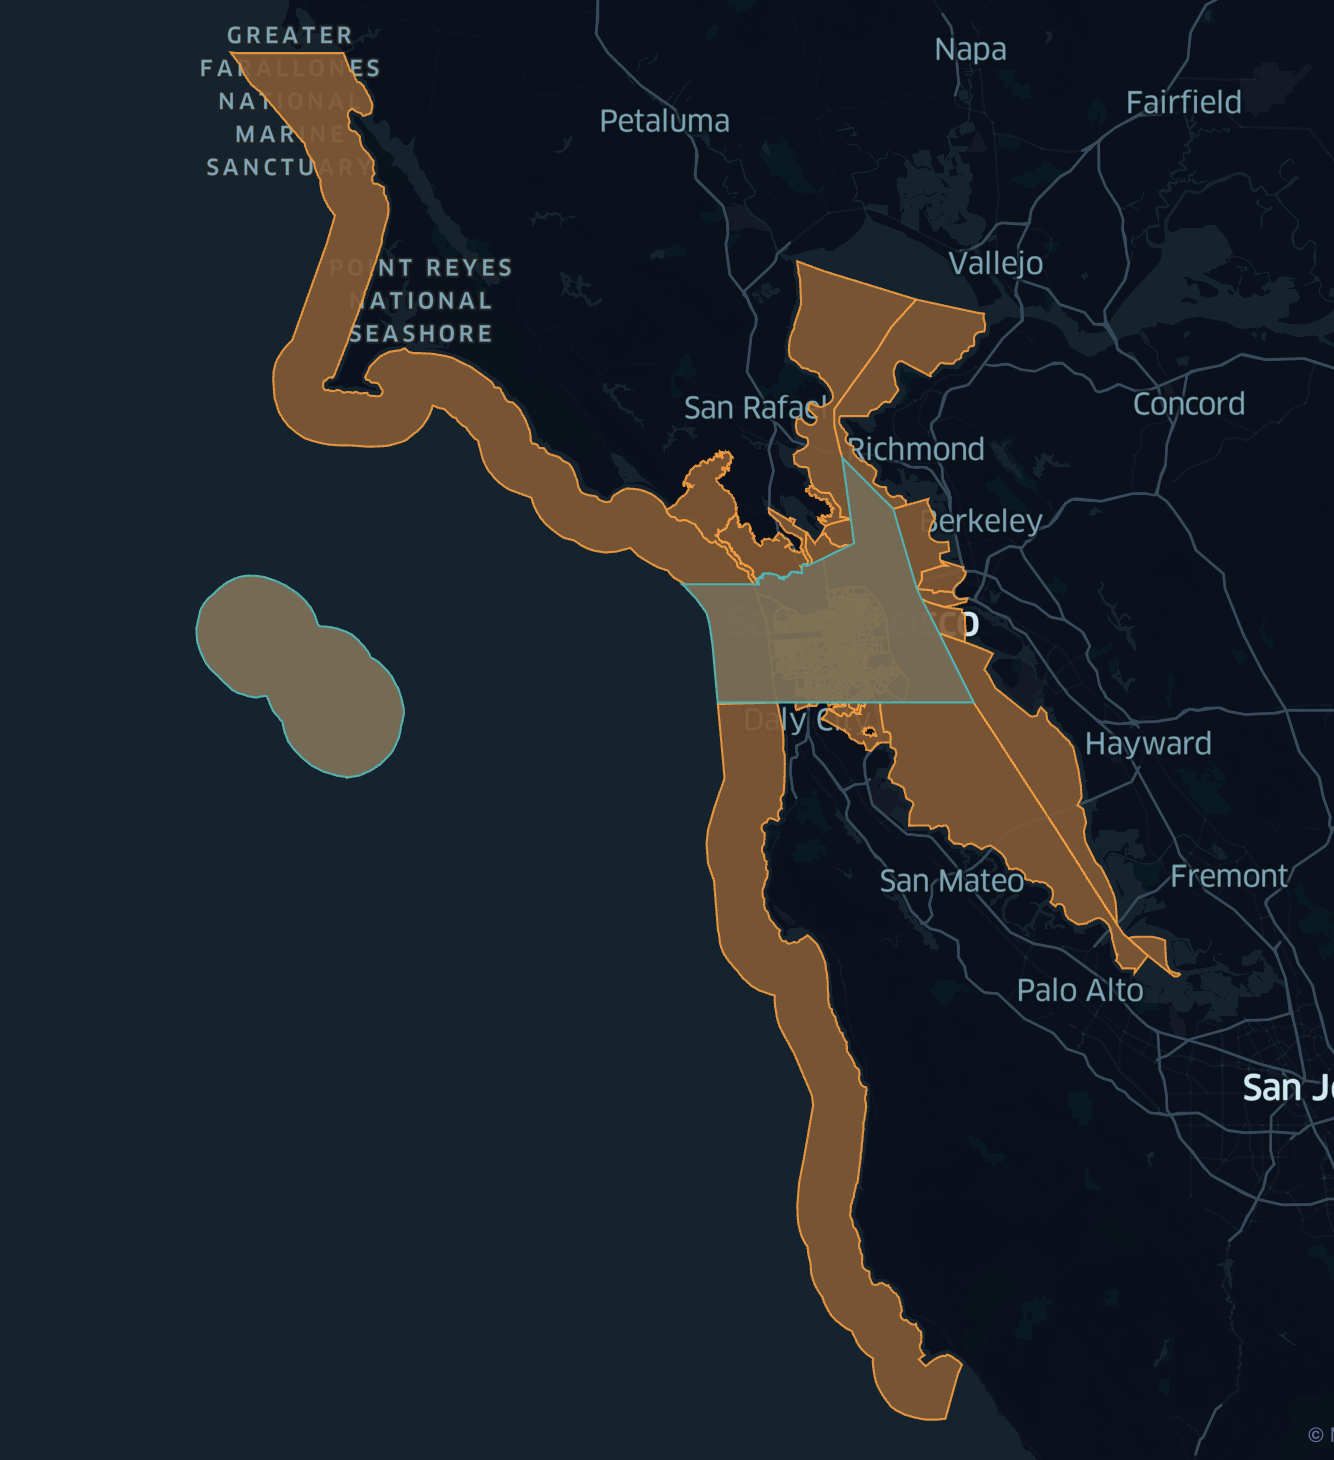
Since the block groups don’t neatly follow city borders (some may overlap multiple cities), I had to optimize which spatial functions to use for each city. Initially, I only used ST_INTERSECTS, but when I visualized this in Unfolded Studio, I was a little dissatisfied with how this looked for San Francisco. I then tried ST_CONTAINS for San Francisco, and it works quite well, sparing a couple missing block groups.
 |
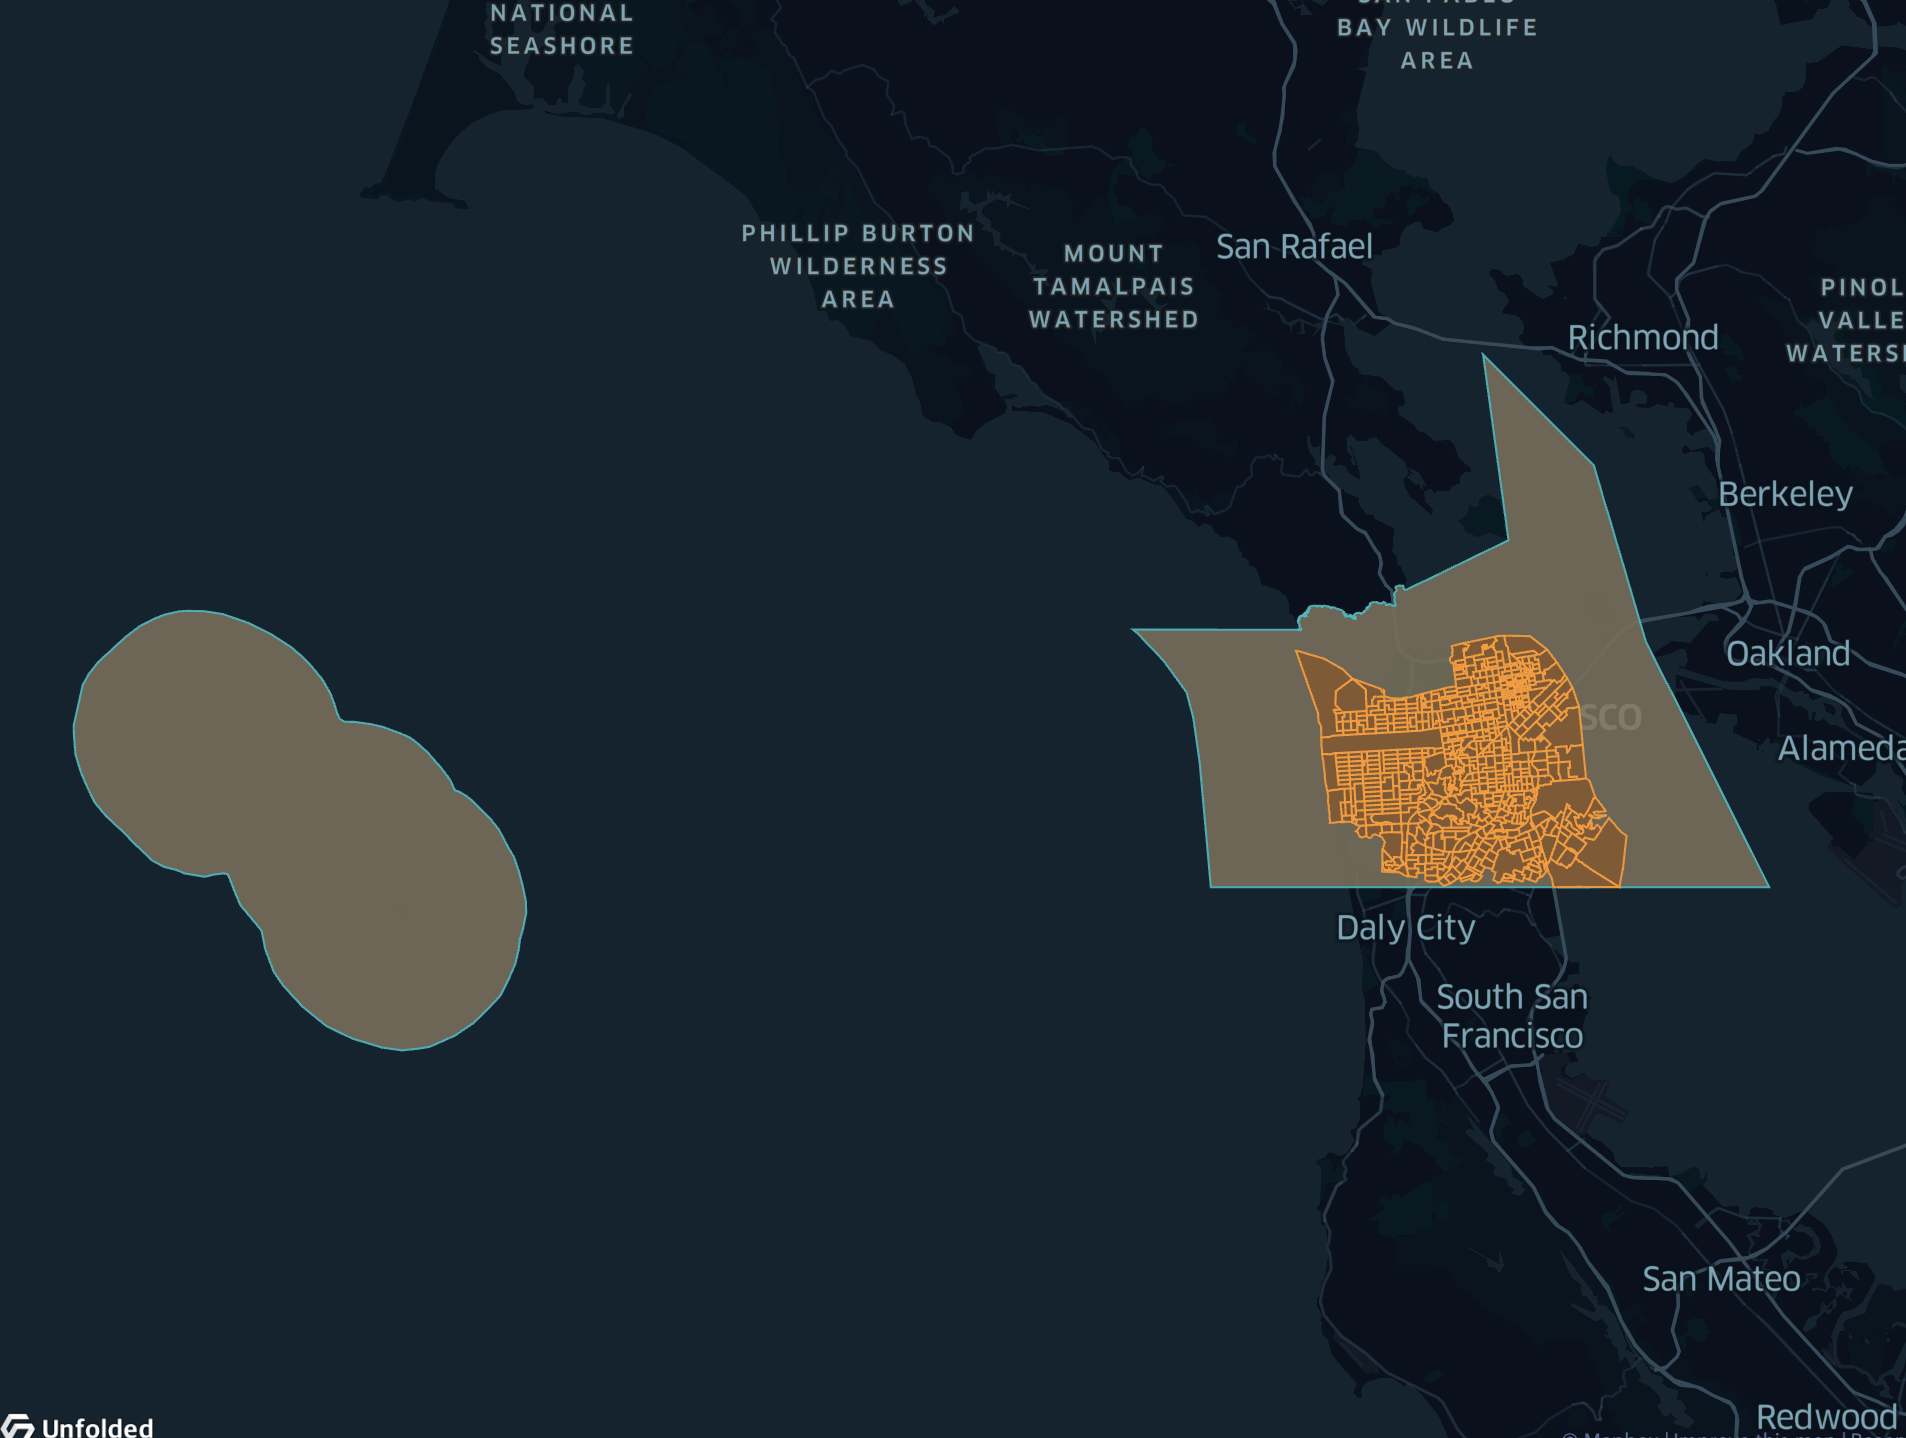 |
ST_INTERSECTS (left) and ST_CONTAINS (right). The block groups are orange, and the city border is blue.
Most of the large wandering block groups in the ST_INTERSECTS picture contain little to no households. The ST_CONTAINS image shows the San Francisco landmass, excluding the bay itself. I’m still not quite sure which option is better.
As for Chicago, I eventually settled on ST_INTERSECTS(city.geometry, block.geom) AND not ST_TOUCHES(city.geometry, block.geom) for Chicago. This helps eliminate some block groups whose edges just touch Chicago’s city border.
So you can take a look, here is my final code for Chicago:
WITH city AS (
SELECT
(
  SELECT value
  FROM UNNEST(all_tags)
  WHERE key = 'name'
) AS name,
geometry
FROM
`bigquery-public-data.geo_openstreetmap.planet_features_multipolygons`
WHERE
('boundary', 'administrative') IN (
  SELECT (key, value)
  FROM UNNEST(all_tags)
)
AND ('admin_level', '8') IN (
  SELECT (key, value)
  FROM UNNEST(all_tags)
)
AND ('name', 'Chicago') IN (
  SELECT (key, value)
  FROM UNNEST(all_tags)
),
block AS (
SELECT
  blockgroup.geo_id,
  blockgroup.state_name,
  blockgroup.county_name,
  blockgroup.blockgroup_geom AS geom,
  metrics.Households,
  metrics.MedianHHIncome,
  metrics.withInternet
FROM `bigquery-public-data.geo_census_blockgroups.us_blockgroups_national` AS blockgroup
INNER JOIN `digitaldivide.census_safegraph.metrics` AS metrics
ON blockgroup.geo_id=metrics.census_block_group
)
SELECT
  city.name,
  block.geo_id,
  block.Households,
  block.MedianHHIncome,
  block.withInternet,
  block.geom
FROM
  city
INNER JOIN
  block
ON
  ST_INTERSECTS(city.geometry, block.geom)
  AND not
    ST_TOUCHES(city.geometry, block.geom)
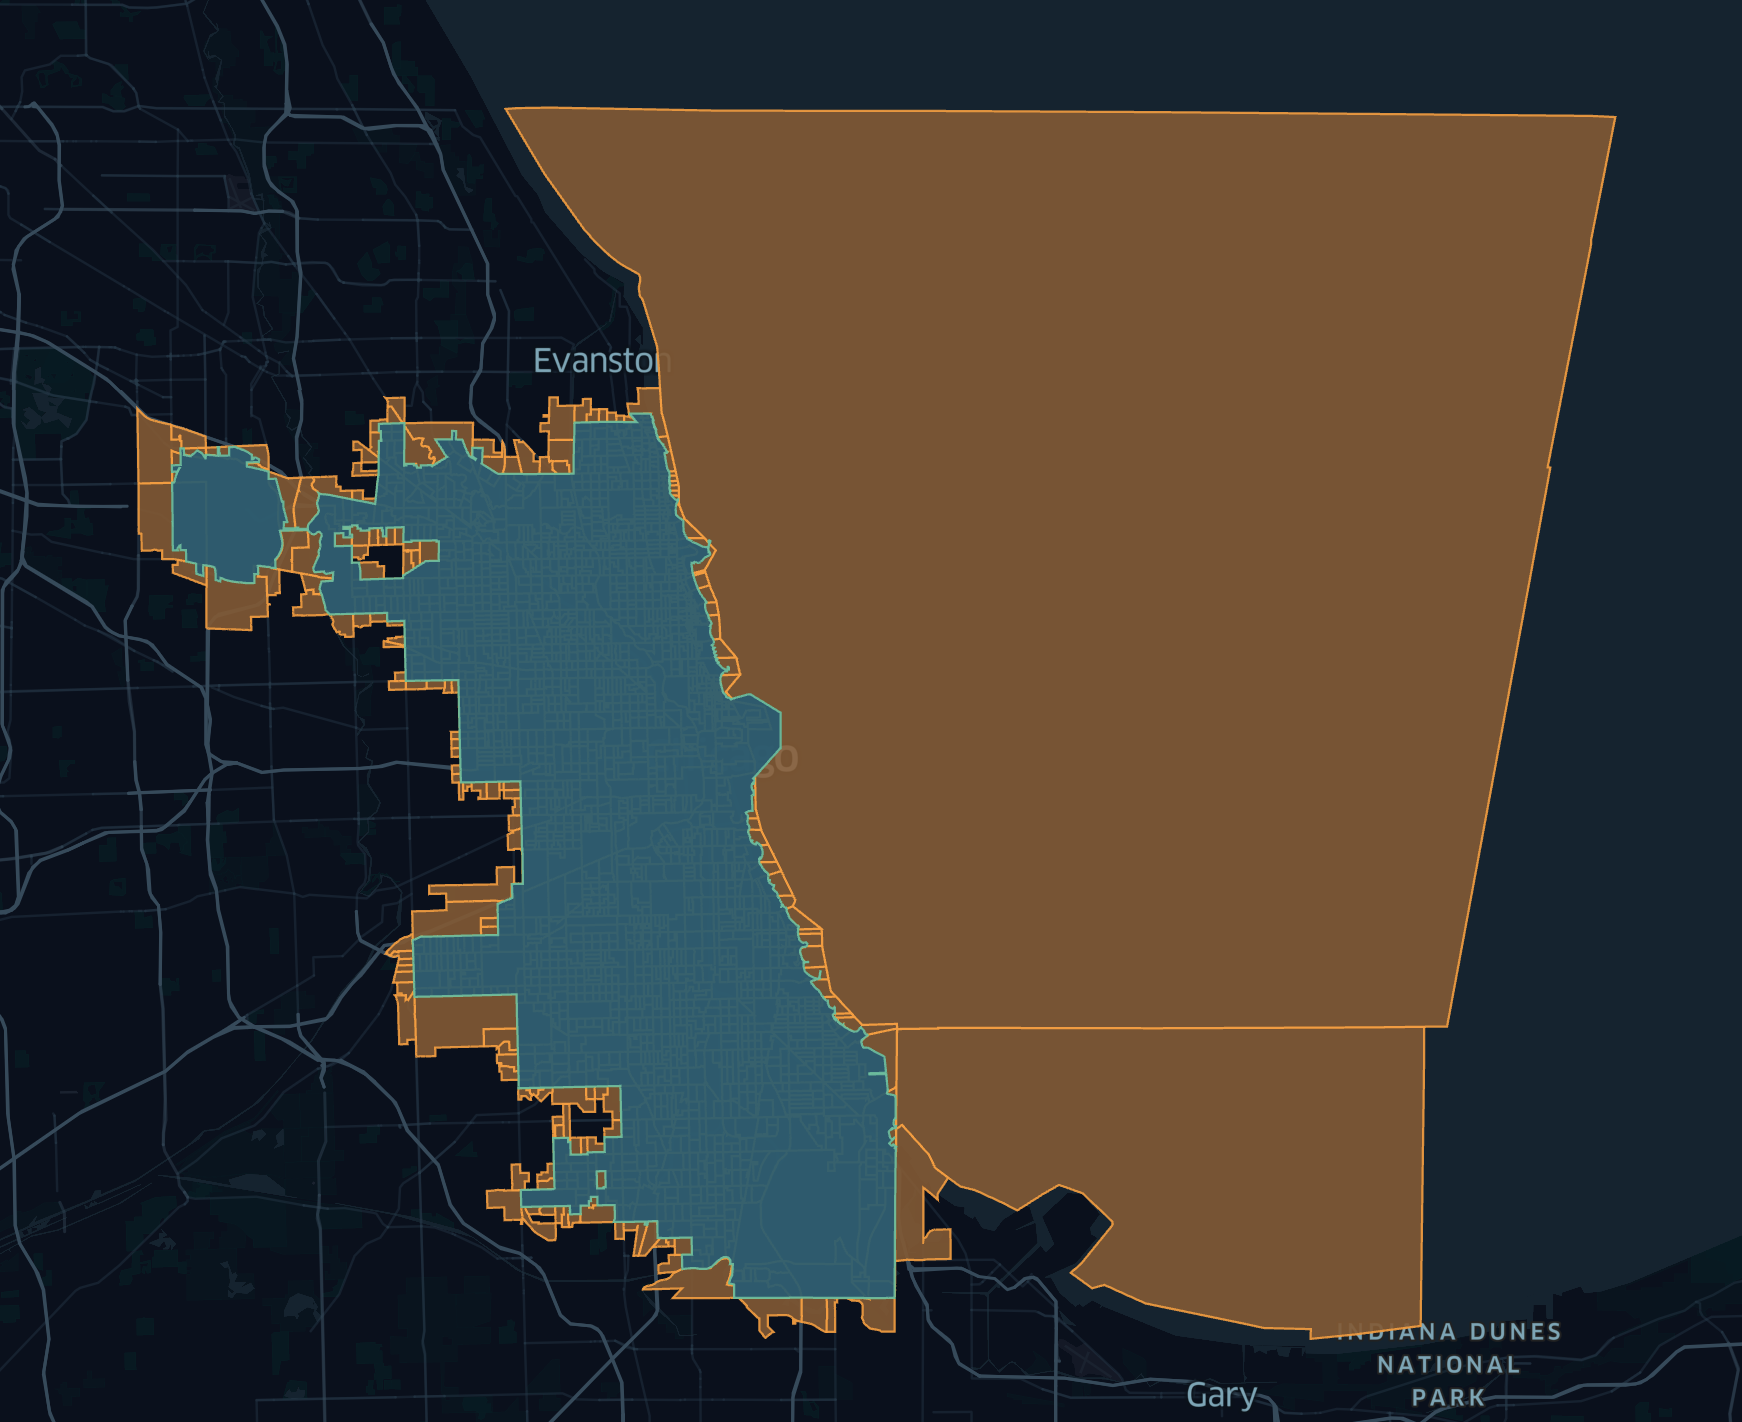
The final result visualized in Unfolded Studio.
Conclusion
It’s probably not the most elegant solution, but it works. This is a great starting point to look at different data. What’s even more interesting is that now we can get data from the American Community Survey at the block-group level in combination with other data sets. Perhaps we could even unify them using something like H3.